
library(plotly) # Load package
my_data <- trees # Assign object (dataset)
plot_ly(
  data = my_data,
  x = ~Height,
  y = ~Girth,
  size = ~Volume,
  color = ~Volume,
  text = ~paste0("Height: ", Height, "<br>Girth: ", Girth, "<br>Volume: ", Volume), height = 300, width = 500
)The Value of Open-Source
Leveraging free, code-first tools to iterate toward advanced analytics
February 27, 2025
A Little Background
Who is QHS?
- Department of 120+ biostatisticians, data scientists, programmers, etc. that collaborate on and supply quantitative support to research activities at Cleveland Clinic
- From clinical trials and study design to precision medicine, population health, AI in medicine, and more, across many disease areas
- My area focuses on clinical prediction modeling and observational statistical analysis, primarily using EHR and/or registry data
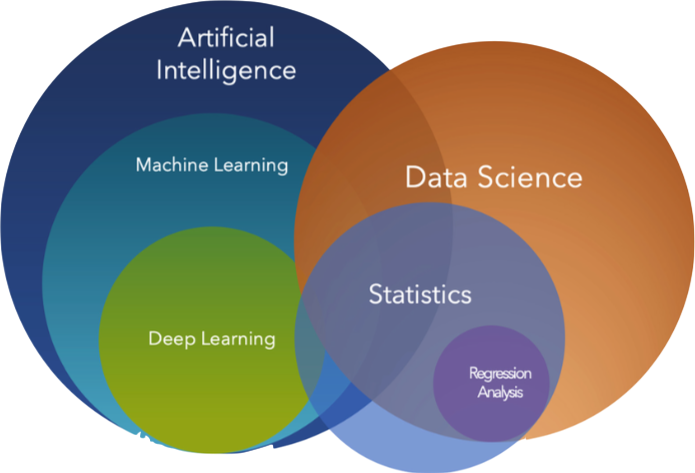
Blurred Lines
- Tend to focus on the first, bypassing the second; conflating views
- Leads to ambiguity and confusion
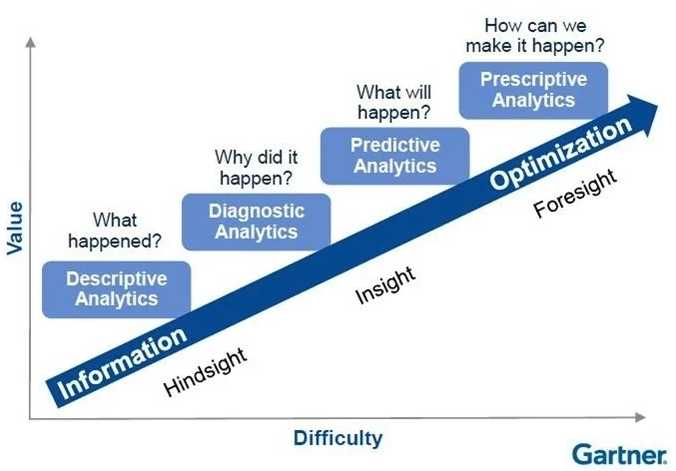
The Horse Before the Cart
Current State
- Gartner (2018): 87% of business at low analytics maturity [1]
Back to Basics
- Are AI tools really the solution?
- “AI for the sake of AI is a losing proposition” [2]. Be intentional!
- Are you capturing what’s important? (Data infrastructure)
- How are you using your data? (Reporting/analytical thinking)
- What are your limitations? (Tools, skills, time, etc.)
Shiny for Web Applications
Background
- Shiny is an R package for building custom, interactive web applications
- You can do it in Python too!
- Allows users to interact with data, analytics, models, etc. however you see fit
Example: Deploying an LLM-powered Shiny app
Example (in R)
library(shiny) # Load package

# The user interface
ui <-
  fluidPage(
    title = "MyApp",
    sidebarLayout(
      sidebarPanel(
        selectInput(
          inputId = "color",
          label = "Choose Color",
          choices = c("red", "blue", "green")
        )
      ),
      mainPanel(
        plotOutput("my_plot")
      )
    )
  )

# How the inputs turn to outputs
server <-
  function(input, output) {

    output$my_plot <-
      renderPlot({
        with(trees, plot(Height, Girth, col = input$color))
      })

  }

# Run the app
shinyApp(ui, server)
How can I learn?
- R for Data Science by Hadley Wickham
- An Introduction to Statistical Learning for statistics and data science foundations
- A free R course on QuantFish
- Endless YouTube resources for R, Quarto, Shiny…and everything else
- Community boards like Posit Community, Stack Overflow, etc.
- Visit Posit PBC’s website and learning resources
- Major developer/maintainer of many tools we talked about today
- First, go install them and mess around
- Make a (small) tangible goal, figure it out, then iterate
- Focus on automation, reporting and reproducibility to start (low hanging fruit)
- Build the foundation for analytics maturity
ChatGPT
- A companion for any and all questions along the way
Shiny Assistant
- An LLM interface to specifically help you develop Shiny apps
- Quickly get a template started for your concept
- Live demo: https://gallery.shinyapps.io/assistant/
What is it?
Background
- riskcalc.org is a free-to-use repository of risk calculators for individualized medical decision making (~10-15K users/month)
- Embedded with published predictive models
- Each calculator is a Shiny application
- Majority are regression models
The Backend
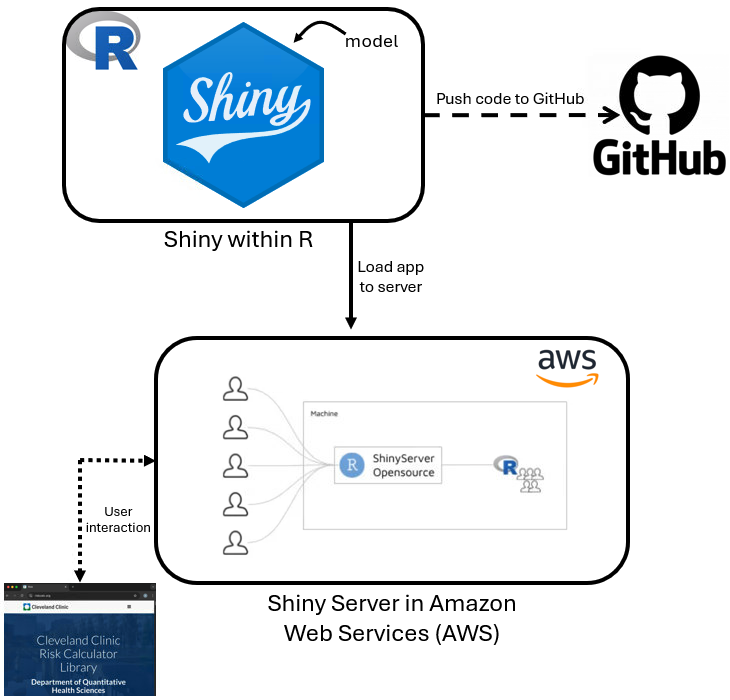
Key points
- Can build working infrastructure for free (to start)
- Incur cost for service as needed
- AWS versus on premises
Acknowledgements
Co-developers
- Alex Milinovich
- Xinge (Kathy) Ji
- Blaine Martyn-Dow
- Other contributors
In Memory

Michael W. Kattan, PhD
Department Chair (2004-2024)
Quantitative Health Sciences
Cleveland Clinic
Creator of riskcalc.org